
Unlocking County-Level CI Scoring: A Deep Dive into Regional Carbon Intensity Insights
For the first time, incite.ag is unveiling to the public its county-level Carbon Intensity (CI) scores derived from the latest USDA BETA Feedstock Carbon Intensity Calculator (FD-CIC), released on January 15, 2025. This initiative leverages comprehensive USDA Census and Survey data, meticulously mapped and modeled within USDA's technical guidelines for Climate-Smart Agriculture (CSA) biofuel feedstocks. We want to empower stakeholders with actionable insights into how regional agronomic practices and soil organic carbon (SOC) dynamics influence CI scores, thereby optimizing tactics for maximizing the 45Z framework.
To facilitate scoring within those 1.15.25 guidelines, the USDA released a beta version of the FD-CIC, enabling the calculation of farm-scale CI in alignment with the interim rule's standards. This tool (which we have leveraged for the insights outlined in this article) allows corn, soybean, and sorghum producers to input specific management practices and receive a standardized CI score.
Genesis of The Data
Traditional regional CI assessments often rely on generalized estimates or standardize nationwide inputs, lacking the granularity needed for precise calculations. Seeking a more precise solution over the past few years, the Incite.ag team delved into the USDA's robust public datasets, in order to generate an improved county-level CI score by incorporating:
- Five-year averages for corn yields and base acres.
- The most recent data on tillage practices, cover crop adoption, and nutrient management strategies, including the use of specific nitrogen-intensive products where available.
- Defaults for specific nitrogen technology & usage, manure use, pesticide use, and energy consumption were used if necessary to fill public data “gaps”.
This comprehensive approach allowed us to construct a detailed CI scoring framework under previous FD-CIC models. By processing this data through Incite.ag’s updated 45Z CI scoring software, we transformed raw publicly available USDA figures into 45-centric insights, enabling stakeholders to now assess their county's potential CI impact under the latest USDA scoring guidelines and frameworks.
Explore Your County’s CI Score
Our interactive maps provide a user-friendly platform to identify your county’s CI score and benchmark it against national data. This transparency offers stakeholders the opportunity to:
- Detect regional trends and advantages in CI scoring.
- Assess how specific management practices influence CI outcomes at the local level.
- Compare potential score adjustments with neighboring counties.
Please note that these CI scores are just estimates and are not to be used in regulated markets or for tax reporting purposes. Information deemed reliable but not guaranteed.

Key Management Practices Influencing CI Scores
Understanding the management practices that drive CI scores is crucial for implementing effective CSA strategies. According to the USDA's technical guidelines and BETA FD-CIC, several practices significantly impact CI reductions as is shown in the table below:
- Tillage Practices: Traditional tillage methods can disrupt soil structure, leading to increased CO₂ emissions. Conversely, reduced tillage or no-till practices enhance soil carbon sequestration by minimizing soil disturbance, thereby lowering CI scores.
- Cover Cropping: The growth of cover crops between cash crops or during fallow periods contributes to soil organic matter, improves soil health, and reduces erosion. This practice enhances carbon sequestration and can lead to a decrease in CI scores.
- Nutrient Management: The growth of cover crops between cash crops or during fallow periods contributes to soil organic matter, improves soil health, and reduces erosion. This practice enhances carbon sequestration and can lead to a decrease in CI scores.
CI Scoring Scenario: Whiteside County, IL. BETA USDA FD-CIC
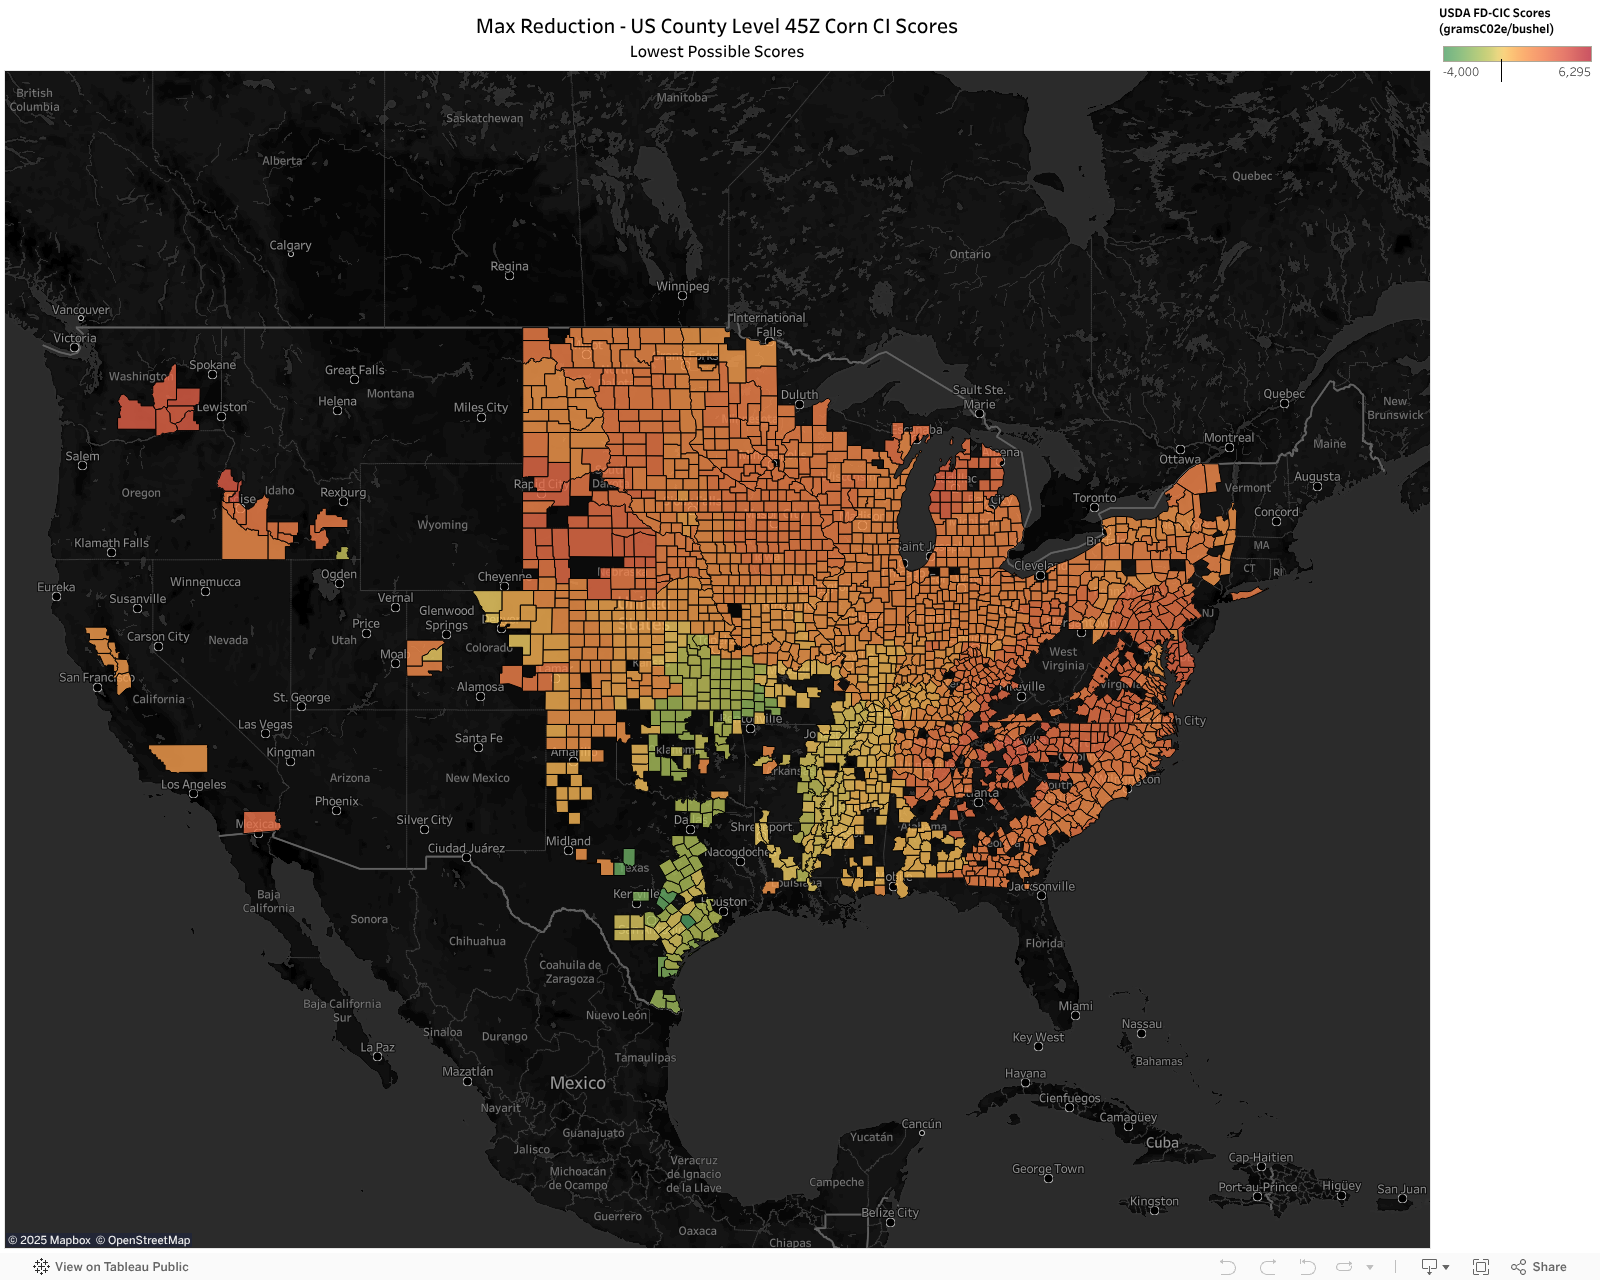
Understanding Maximum CI Score Reductions
Beyond current CI estimates with regional USDA data, our second map helps reveal Maximum CI Score Reductions per county, offering insights for stakeholders aiming to optimize their practices or understand inherent regional advantages within current modeling. Different counties provide varying levels of credit for management adjustments based on their unique SOC modeling. This indicates that the same practice—be it reduced tillage, cover cropping, or refined nitrogen management—can have markedly different impacts on CI scoring depending on the county's specific characteristics. Additionally CI reductions are not linear for all management practices in all counties, meaning that a practice combo that may “max out” a CI reduction with one county’s modeling may have a CI reduction exceeded by a different management practice combo in another county.
Please note that the map below reflects a No Till + Cover Crop + Fall N w/ Nitrification Inhibitor management combo which is the most widely-adaptable “max CI reduction” suite of practices.
Implications for Stakeholders
For biofuel producers, growers, and supply chain partners engaged in CI scoring, this dataset offers unparalleled insight into the factors shaping 45Z eligibility and incentive structures. The ability to analyze county-level shifts in scoring has the potential to unlock new strategies for improving farm-level performance, optimizing supply chain decisions, and ensuring compliance with evolving federal requirements.
Incite.ag remains steadfast in our commitment to equip our network with superior data to navigate the 45Z landscape. By publicly sharing these insights, we aim to elevate industry-wide understanding and drive informed decision-making—ensuring that every stakeholder possesses the tools necessary to turn their emissions into income.
Explore the maps, delve into the data, and begin strategizing for the future of CI scoring. The information is now at your fingertips!
Riley Harbaugh, CCA
General Manager, incite.ag
———
Incite.ag guides producers across the agricultural supply chain to Turn Emissions into Income. Incite.ag’s CI scoring system unlocks novel revenue streams and empowers producers to take control of their unique CI Scores. Learn more by hitting the link below or reach out to the team directly at [email protected] or 815.373.0177.
